
How Energy Models trim 80% from Root Cause investigation time
12 December 2023
In the drug delivery sector, time really is money. Every day spent developing a drug delivery system increases development costs and reduces the window between bringing a profitable drug to market and its patent expiring. Energy models are a tool which allow for the most critical elements of a root cause investigation to be targeted, potentially saving weeks on identifying and solving issues. Energy models can also be used to predict the performance of a device, and how this is impacted by design changes.
What is an energy model?
An energy model is a mathematical model that investigates the energy transfer at all interactions in a system. An energy model is advantageous to a force model as it is less susceptible to inertia effects and can more elegantly handle gearing effects and conversions between forces and torques allowing interactions to be compared on a like for like basis. As with force models, an energy model is based on how the system is designed to operate – it does not consider unexpected interactions.
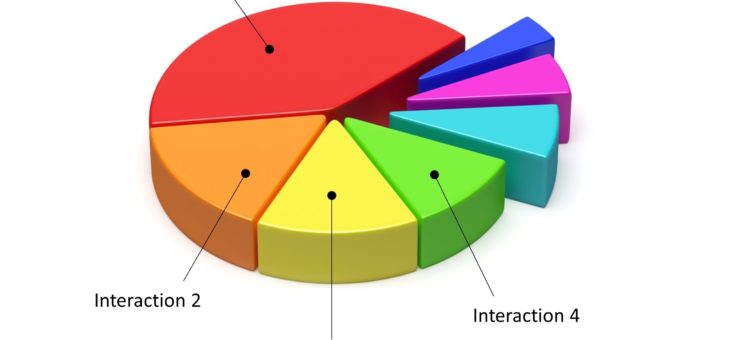
Often, the majority of energy dissipated in a device is caused by just a few interactions. Therefore, it is common to see an energy model simplified to consider only the most significant interactions.

Figure 1: Illustration of examples energies dissipated by each interaction, as outputs predicted by an energy model. Often, a few interactions dissipate most of the energy in a device.
How does an energy model save time during a root cause investigation?
There are several methods used to conduct a root cause investigation. One common method is to use a cause-and-effect diagram (also called Ishikawa diagrams). These diagrams help break down potential causes to a more granular level, which can then be tested to verify the root cause of the problem. For even a simple device, a cause-and-effect diagram can become very large. The cause-and-effect diagram shown below was produced for an inhalation device Springboard recently worked on. Over 50 testable potential root causes were identified, which could have taken several months to test and verify the true root cause.
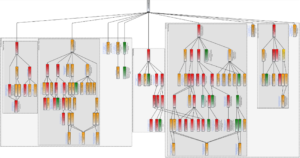
Figure 2: A cause-and-effect diagram developed on a recent project.
To avoid an overly time consuming and expensive test program, an energy model developed for the device can instead be used to identify the most likely root causes and focus the investigation. In our inhalation example, a common potential root cause was for friction coefficients to be high, as there were several rubbing interactions, and inefficient lead screws in the device. Furthermore, inputs to the model, like coefficients of friction, could be varied to understand if variation in these parameters could explain the observed issues.
The graph below shows the energy dissipated by each interaction in the device, and how this changed when a particular friction coefficient was increased by 20%. The graph shows that the energy dissipated by the most wasteful interaction (‘CD’) doubled. This highlighted how sensitive the system was to changes in friction coefficient and demonstrated that this coefficient alone could plausibly explain the high energy loss they were observing.
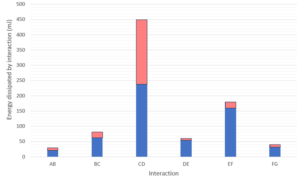
Figure 3: Predicted energy dissipated for each interaction in the inhalation device (blue). The red bars show the increase in energy dissipated when the individual friction coefficients were increased by 20%.
Important considerations when developing an energy model
There are several important considerations to get right when developing an energy model, which include:
- Ensure that the team fully understands the device – Springboard has experience working with a wide range of devices in drug delivery and other markets so has plenty of experience gaining familiarity with new devices quickly.
- Perform tests to validate your model – Testing individual interactions is necessary to ensure that the model is capturing the correct physics. Springboard has experience with rapidly developing test fixtures for testing which limits delays with this step.
- Consider how the reality could differ from what the model predicts – could assembly errors or uncontrolled testing conditions be impacting the device?
What was the outcome for our client?
Prior to engaging Springboard’s services, our client had been testing one hypothesis at a time for over 6 months. Over the course of our 4 week project, Springboard was able to narrow down the large search space to only 3 potential root causes which required further investigation – saving our client time and money.
If you want to speed up your root cause investigation, please contact us today.
Written by James Alexander