
The error of our eye directs our mind: the importance of measuring intraocular pressure correctly
5 January 2022
Photo by Amanda Dalbjorn on Unsplash
Like most complex systems, the human eye occasionally malfunctions with potentially grave effects on lifestyle and mental health [1]. To assess whether a patient’s eye condition is improving under an established treatment, or whether a novel treatment shows promise, it is critical to measure the state of the eye and understand the results of those measurements.
This article lays out the various ways that one can measure an important indicator of the health of the eye—the intraocular pressure—and the strengths and weaknesses of each technique. As specialists in medical device development, we hope that disseminating this understanding helps others in the field, such as developers of intraocular injections, to measure the effectiveness of their devices, and so best guide their development.
What is intraocular pressure, and why is it important?
The optic nerve is the electrical highway between the eye and the brain, and damage to the optic nerve head is a world-leading cause of irreversible blindness known as glaucoma [2]. The main factor that increases the risk of glaucoma is an elevated intraocular pressure (IOP), that is, the pressure of the fluid within the eye of a patient. Lowering the IOP improves patient outcomes and is the target of most glaucoma medications [3, 4, 5], and physicians regularly monitor IOP to screen, regulate and adjust glaucoma treatment [6, 7].
How is intraocular pressure measured?
Because the eye is one of the most accessible organs of the body, it benefits from an unusually broad array of diagnostic tools and treatments. Invasive measurements of IOP such as ocular manometry (which involves the insertion of a fine needle into the patient’s eye) are the most effective but are rarely carried out because the potential benefits are outweighed by the requirement of general anaesthesia and risk of eye infections.
Most measurements of IOP are instead non-invasive and take advantage of a form of the Imbert-Fick law [8, 9, 10], which can be interpreted as:
When a mass rests on a thin spherical vessel, the pressure within the vessel is equal to the weight of the mass divided by the contact area between the mass and the vessel.
The complexity of the eye requires some simplifying assumptions to be made to use the Imbert-Fick law to measure IOP. The two major assumptions are:
- The placement of a weight on the eye has a negligible effect on IOP.
- The eye is a thin-walled vessel, so the weight of the mass placed on the eye is not supported by any bending stresses in the cornea [10]. This is typically further justified by designing the size and shape of the mass applied to the eye such that any small forces present due to bending stresses are balanced out by the pulling down of the mass by the surface tension of the tear film [9, 10].
There are three common non-invasive techniques to measure IOP, and we consider each of these in turn.
Goldmann applanation tonography (GAT)
GAT is the conventional method of non-invasive IOP measurement techniques [11, 10], and utilises a form of the Imbert-Fick law. GAT is performed by placing a disc onto the surface of the eye that is illuminated by a thin sheet of light from a slit lamp, and measuring the force required to achieve full contact between the face of the disc and the eye.
Despite being the standard technique, GAT is somewhat susceptible to errors due to variations in central corneal thickness between patients. Typically, clinicians use an optical or ultrasound device called a pachymeter to measure the thickness of the cornea and use this to contextualise any pressure measurements taken [11]. Some of the other drawbacks of GAT are that it requires expensive specialist equipment, compliant patients, and well-trained operators.
Attempts to solve some of the drawbacks of GAT have been made and adopted into other measurement techniques – examples of these include rebound and puff tonometry, which we consider next.
Rebound and puff tonometry
Rebound tonometry is a dynamic technique in which an impact probe is fired towards the eye, and its resultant motion is observed and used to ascertain the IOP. Puff tonometry is a similar process in which a puff of air is used in place of the probe. Optical instrumentation can then be used to automatically measure the applanation area (the area of the convex surface which is flattened).
Both puff tonometry and rebound tonometry are performed using small handheld devices which do not require the application of topical anaesthetics, are considered to be non-contact due to their short acquisition times and are suitable for less-compliant patients. However, dynamic and non-contact measurements inherently have a higher uncertainty compared to static contact approaches. For example, IOP measurements from puff and rebound tonometry can often differ from GAT values due to their dependence on the thickness of the cornea [11]. Furthermore, even when the central corneal thickness is known, the bias in IOP measurements due to variations in central corneal thickness is difficult to account for [12].
Shiøtz tonography
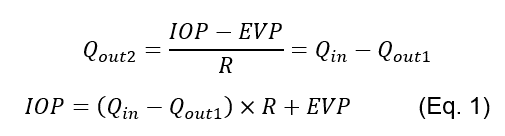
Considering the mechanism by which IOP is generated in the first place can also offer additional diagnostic value. The fluid within the eye, called the aqueous humour, serves the purpose of nourishing cells and removing waste, and must therefore be constantly replenished. The eye is a fluid-filled compliant vessel, so an increase in the volume of aqueous humour in the eye also increases the IOP1. Aqueous humour is produced by ciliary processes at a constant rate (Qin) and either drains through a pressure-insensitive pathway at a constant rate (Qout1), or through a hydraulically resistive network of episcleral vessels (with an average resistance R and flow rate Qout2). This is summarised in Figure 1.
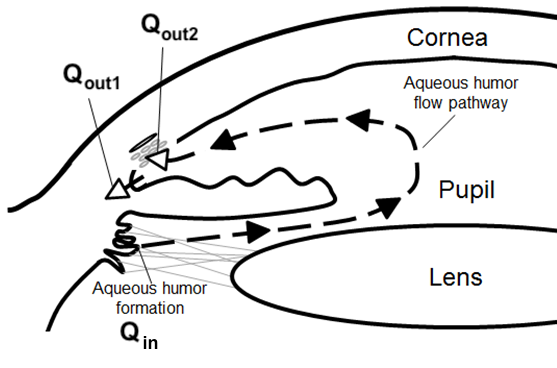
Figure 1: The flow of aqueous humour within the eye [13]
Therefore, an elevation in steady-state IOP can be caused by an increased resistance to aqueous humour drainage [3], and measurements of the resistance to drainage R may complement IOP measurements [12].
Historically a Shiøtz tonometer has been used to measure both IOP and R. This apparatus uses a plunger that moves through the centre of a baseplate. When the tonometer is placed onto the eye the IOP increases, which results in the outflow of aqueous humour outweighing the inflow. The net result is an exponential decay in IOP toward a value that satisfies Eq. 1 (the decrease in the volume of fluid within the eye resulting in a decrease in IOP as a consequence of ocular compliance). The decrease in the volume of the eye is recorded by the motion of the Shiøtz tonography plunger relative to the baseplate, and the rate of plunger displacement is used alongside the plunger position at the start of the procedure to ascertain values for IOP and R [8, 9]. Shiøtz tonography also provides graphs of the plunger displacement over time which can be used to measure the success of the procedure, but has the disadvantages of requiring large equipment along with compliant patients that must remain still in the supine position for at least 4 minutes [12].
Comparison
Overall, although there are numerous tools and devices that can be used for the measurement of IOP and potential subsequent diagnosis and treatment of glaucoma, efficient use of these tools requires a comprehensive appreciation of their advantages and drawbacks. Table 1 below compares the techniques discussed in this article. No single method will be a best fit for all situations, and in some difficult cases the diagnosis of progressive glaucoma can instead be made by an experienced ophthalmologist examining the patient’s optic nerve head and measuring their field of vision [10]. The continued need for this more qualitative approach demonstrates that this field could have the potential for further innovation.
Table 1: Comparison of different IOP measurement techniques
| GAT | Puff/rebound tonometry | Shiøtz tonometry | |
| Accessibility | Requires a procedure room | Portable (Handheld) | Requires a procedure room |
| Patient compliance required | High | Moderate | High |
| Patient position during measurement | Sitting | Sitting/Standing | Supine |
| Measurement type | Contact (risk of corneal abrasion, infections etc) | Non-contact | Contact (risk of corneal abrasion, infections etc) |
| Parameter measured | IOP | IOP | IOP and R |
| Data output | Single measurement | At least 3 repeat measurements which are used to calculate a mean and range | · A graph of plunger indentation with time · Graph continuity, ocular pulse visibility and breathing motion are indicative of quality · IOP and R are calculated from the graph |
Conclusion
With ocular injections becoming increasingly common and the measurement of IOP often necessary for the development of novel delivery devices, it is crucial to understand the pros and cons of the discussed techniques when operating in this field. As has been demonstrated in this article, the selection of an appropriate technique for a custom application can be a complex process. At Springboard we have a well-informed and open-minded approach to device development that allows us to investigate novel designs in the context of such existing techniques. Contact us if you would like to find out more about our work, or how we might be able to work together in the future.
Notes:
1 The relationship between pressure and volume of a compliant vessel is dV/dIOP = C, where C is a constant termed vessel compliance and V is the volume of the eye. The relationship between pressure and volume of the eye is often cited as: dV/dP = 1/(k x P) [14] where k is a constant. Several researchers have attempted to improve this mathematical description by proposing other relations between volume and pressure – Pallikaris (2010) presents a review of some of these descriptions.
2 The possibility of a pressure dependent resistance to outflow [15] is not allowed for.
References
| [1] | D. De Leo, P. A. Hickey, G. Meneghel and C. H. Cantor, Blindness, Fear of Sight Loss, and Suicide, vol. 40, 1999, pp. 339-344. |
| [2] | C. G. V. De Moraes, T. S. Prata, J. Liebmann and R. Ritch, Modalities of Tonometry and their Accuracy with Respect to Corneal Thickness and Irregularities, vol. 1, 2008, pp. 43-49. |
| [3] | R. C. Drews, Manual of Tonography, C. V. Mosby Company, 1971. |
| [4] | C. R. Ethier and C. A. Simmons, Introductory biomechanics: from cells to organisms, Cambridge University Press, 2007. |
| [5] | J. S. Friedenwald, Standardization of tonometers decennial report by the Committee on Standardization of Tonometers, American Academy of Ophthalmology and Otolaryngology, 1954. |
| [6] | J. Gloster, Tonometry and tonography, vol. 5, International ophthalmology clinics, 1965, pp. 911-1133. |
| [7] | A. Heijl, M. Lekse and B. e. a. Bengtsson, Reduction of intraocular pressure and glaucoma progression: Results from the early manifest glaucoma trial, vol. 120, Archives of Ophthalmology, 2002, pp. 1268-1279. |
| [8] | M. A. Kass, D. K. Heuer and E. J. e. a. Higginboham, The Ocular Hypertension Treatment Study: a randomized trial determines that topical ocular hypotensive medication delays or prevents the onset of primary open-angle glaucoma, vol. 120, Archives of Ophthalmology, 2002, p. 701–13. |
| [9] | J. Landers, I. Goldberg and S. L. Graham, Analysis of risk factors that may be associated with progression from ocular hypertension to primary open angle glaucoma, vol. 30(4), Clinical & experimental ophthalmology, 2002, pp. 242-247. |
| [10] | M. C. Leskea, A. Heijl, L. Hyman, B. Bengtsson and E. Komaroff, Factors for progression and glaucoma treatment: The Early Manifest Glaucoma Trial, vol. 15, Current Opinion in Ophthalmology, 2004, pp. 102-106. |
| [11] | J. C. Morrison, K. B. Nylander, A. K. Lauer, W. O. Cepurna and E. Johnson, Glaucoma drops control intraocular pressure and protect optic nerves in a rat model of glaucoma, vol. 39, Investigative Ophthalmology & Visual Science, 1998, pp. 526-531. |
| [12] | S. Nair, V. Mohanraj, R. Madhavan and S. Mohan, Vibro-electrical stimulation based intra-ocular pressure (IOP) and aqueous humour flow regulation in human eye, 2014. |
| [13] | I. G. Pallikaris, A. I. Dastiridou, M. K. Tsilimbaris, N. G. Karyotakis and H. S. Ginis, Ocular rigidity, vol. 5, Expert Review of Ophthalmology, 2010, pp. 343-351. |
| [14] | H. A. Quigley, Glaucoma, vol. 377, The Lancet, 2011, pp. 1367-1377. |
| [15] | J. M. Sherwood, E. Reina-Torres, J. A. Bertrand, B. Rowe and D. R. Overby, Measurement of Outflow Facility Using iPerfusion, vol. 11, PLOS ONE, 2016. |
– Michael Madekurozwa, Finn Heraghty and Gabriel Villar