
How a failure of imagination could kill your product (and how to save it!)
17 December 2021
In 2020, the FDA released draft guidance suggesting that emergency medical devices such as autoinjectors should meet a standard of 99.999% reliability at the 95% confidence level. What will it mean for your device as this guidance becomes the industry standard? You could test the devices; but to reach that confidence level you would need to test 300,000 of themi. This is just not feasible for single-use devices, which often must be tested destructively.
This article describes how you could save your product using reliability analysis, involving fault tree analysis and Monte Carlo simulations. We will illustrate the approach using a hypothetical autoinjector as an example, but it can be applied to any complex system.
A simple example
To establish the reliability of a complex device, we can systematically break it down into simpler sub-systems, work out the reliability for each, and combine those to obtain a whole-device reliability.
Step 1: build a fault tree
The first step is to perform a fault tree analysis, which establishes all the conceivable routes to failure and allows us to examine the likelihood of one failure mode at a time. A simplified example of a fault tree for an autoinjector is shown in Figure 1. Orange nodes are root causes, and yellow nodes are intermediate steps to the red node: overall device failure. To determine the probability of failure, we must determine the probability of each of the orange root causes in turn.
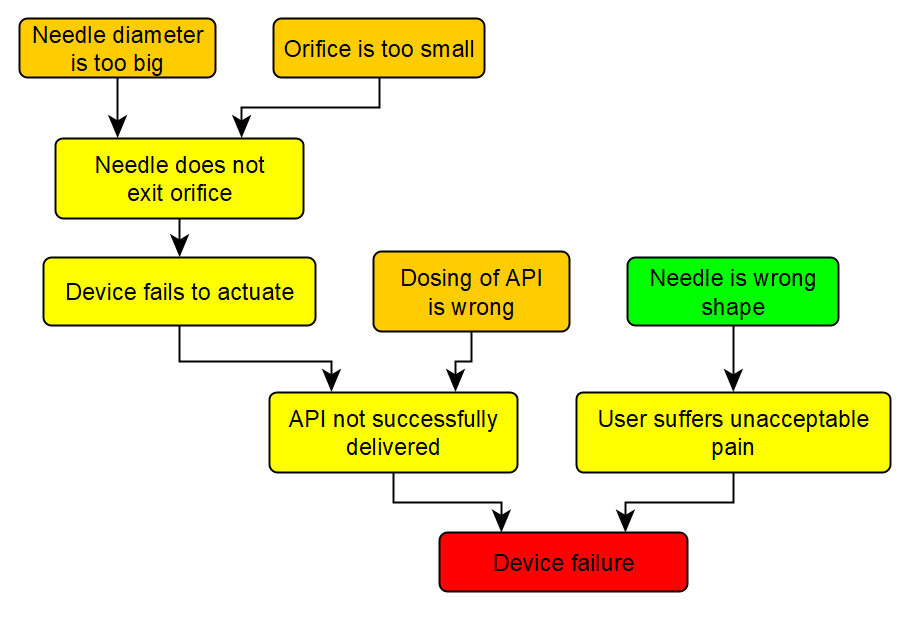
Figure 1: A fault tree for a hypothetical device. API = active pharmaceutical ingredient.
Step 2: calculate the reliability associated with each root cause
We can now use the fault tree to systematically consider each root cause in turn, and for each calculate its expected failure rate at the 95% confidence level.
Root cause: needle is wrong shape
In this hypothetical case, all needles are checked for correct shape in-line by the operator, so the green node can be discounted. Of course in reality, we would have to qualify the inspection process, which would itself have a failure rate.
Root cause: dosing is wrong
It is relatively easy to establish a reliability for the dose of the active pharmaceutical ingredient (API): during process qualification, data will have been generated on the loading of the API, and there will be minimum and maximum acceptable limits on this. It can be as simple as fitting an appropriate distribution and looking at the tails to see what the probability is of exceeding the limits. As a first approximation, we can use a normal distribution.
But hold on! To meet the “95% confidence” requirement, we need to put confidence limits on this reliability. We fitted a distribution only to a finite sample, so it will be only an approximation to the distribution of the whole population. Fortunately, statisticians have figured out how to quantify this uncertainty in our estimate of the true distribution.
Another way of saying this is that there is an ensemble of possible population distributions that might have given us the sample that we measured during process qualification. This is where Monte Carlo analysis comes in: it allows one to model statistical outcomes of a complex sequence of events, and is discussed in more detail in another blog post. Using this technique we can look at the tails of many normal distributions from this ensemble, each with its own reliability. We can now plot a histogram of these reliabilities, exemplified in Figure 2.
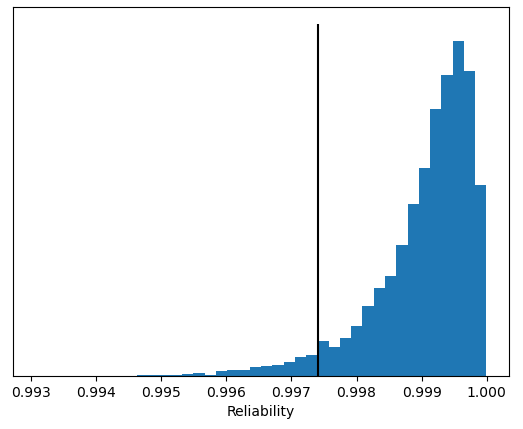
Figure 2: Reliability histogram for API dosing.
The black line in Figure 2 indicates the 95% confidence limit, so we can claim at 95% confidence that this failure mode does not occur just over 99.7% of the time. In other words, 95% of the distributions from the ensemble had a reliability of 99.7% or better.
Root cause: orifice is too small/needle diameter is too big
These two root causes sound similar, but they are distinct. The failure mode “Orifice is too small” means that the orifice is smaller than its specified lower bound, so that a needle within its specification is not guaranteed to go through that orifice. Conversely, the case of “Needle diameter is too big” refers to a needle that is outside of its specification and cannot fit through an orifice that is within its own specification.
These root causes can be accounted for in at least two ways:
-
Separately, i.e. we can perform a tolerance stack analysis for the orifice, put specification limits on it, and consider whether a given orifice meets its specification as we did for the API dosing; and similarly for the needle.
-
Jointly, i.e. we could look at the overlap between the distributions of the orifice and needle dimensions.
Either way, we can generate a similar reliability histogram for the intermediate step “Needle does not exit orifice”.
Step 3: combining the reliabilities
Now we have a distribution of failure rates for each mode, we need to combine them to give an overall failure rate at 95% confidence. A crude approach is to add the 95% confidence failure rates for each mode to give an over-estimate of the overall 95% confidence failure rate. There are a few ways of improving on this by sampling from the failure rate distributions we have calculated, but that is beyond the scope of this article.
Reliability analysis in the real world
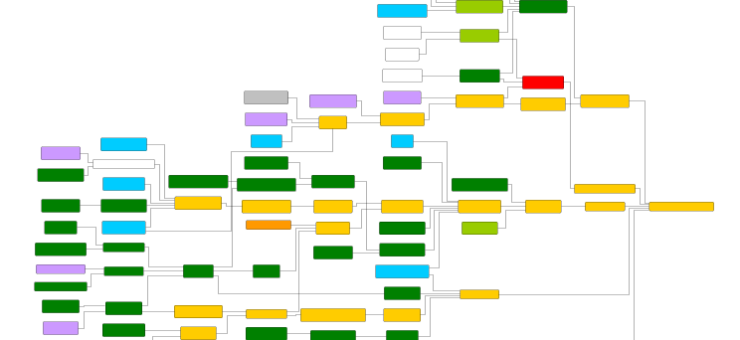
Astronaut Frank Borman described the Apollo 1 disaster, in which three people burned to death, as a “failure of imagination”. This phrase captures the challenge of considering all possible factors that could lead to a failure and the complex interplay between them; and it applies equally to an autoinjector or the Command Module. A real fault tree analysis is a complex, multidisciplinary undertaking that must consider the interaction of mechanical engineering, materials science, electronics, manufacturing, and human factors. Here, our engineers’ experience in developing and trouble-shooting all sorts of medical devices really adds value to a project. A diagram of a fault tree from a real medical device is shown in Figure 3.
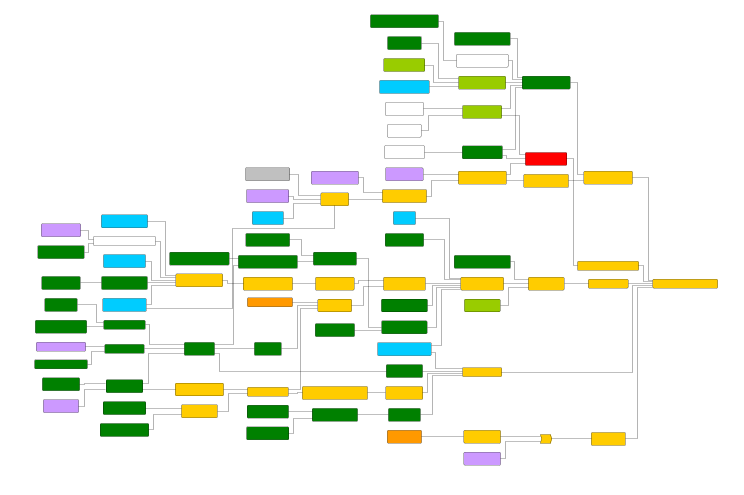
Figure 3: A diagram of a fault tree from a real medical device. Details have been censored to protect client confidentiality.
In a real device, it may be necessary to consider the effect of stressors, such as age, temperature, or damage: Springboard can help to design a bespoke test programme to assess the effects of these factors.
Springboard has developed methodology and code for performing these analyses for regulatory submissions. If you would like to get in touch about our capabilities with regard to your product, please contact us.
– Omar Shah
i Assume the device only just fails to meet the specification, i.e. its reliability is p = 99.999%. Suppose we test n devices independently; then the probability that they all work is pn. To achieve 95% confidence, we insist that this outcome occur at most 5% of the time, so we set pn = 0.05, or 0.99999n = 0.05. Therefore n = log(0.05) / log(0.99999) ≈ 300,000.